The Hyve is happy to announce that Glowing Bear, the new i2b2 tranSMART user interface, was officially launched on 13th September.

Glowing Bear unlocks the full potential of tranSMART 17.1. The tranSMART data warehouse enables the sharing, storing and analysis of various types of biomedical data. It was originally developed by Janssen R&D in 2009 and has since been adopted by pharmaceutical companies, universities and academic hospitals all over the world.
In 2016-2017 the i2b2 tranSMART Foundation initiated the 17.1 project. The Hyve has been actively involved in the development of this new and updated version of tranSMART. Added functionalities include support for longitudinal data sets and the option to save and re-execute queries.
New interface
The 17.1 project, however, did not include an adaptation of the tranSMART user interface to support the new functionalities. Therefore, The Hyve started project ‘Glowing Bear’: the development of a new, modern user interface for tranSMART 17.1 that would unlock the full potential of its added functionalities. Currently, leading medical and research institutions in The Netherlands have adopted Glowing Bear: the Princess Máxima Center for Pediatric Oncology, the Netherlands Twin Registry (NTR), and Leiden University Medical Center (LUMC).
This demo gives a good impression of the range of options Glowing Bear provides when selecting a subset of patients from the tranSMART database.
Earlier this year, we published a comprehensive overview of the new user interface.
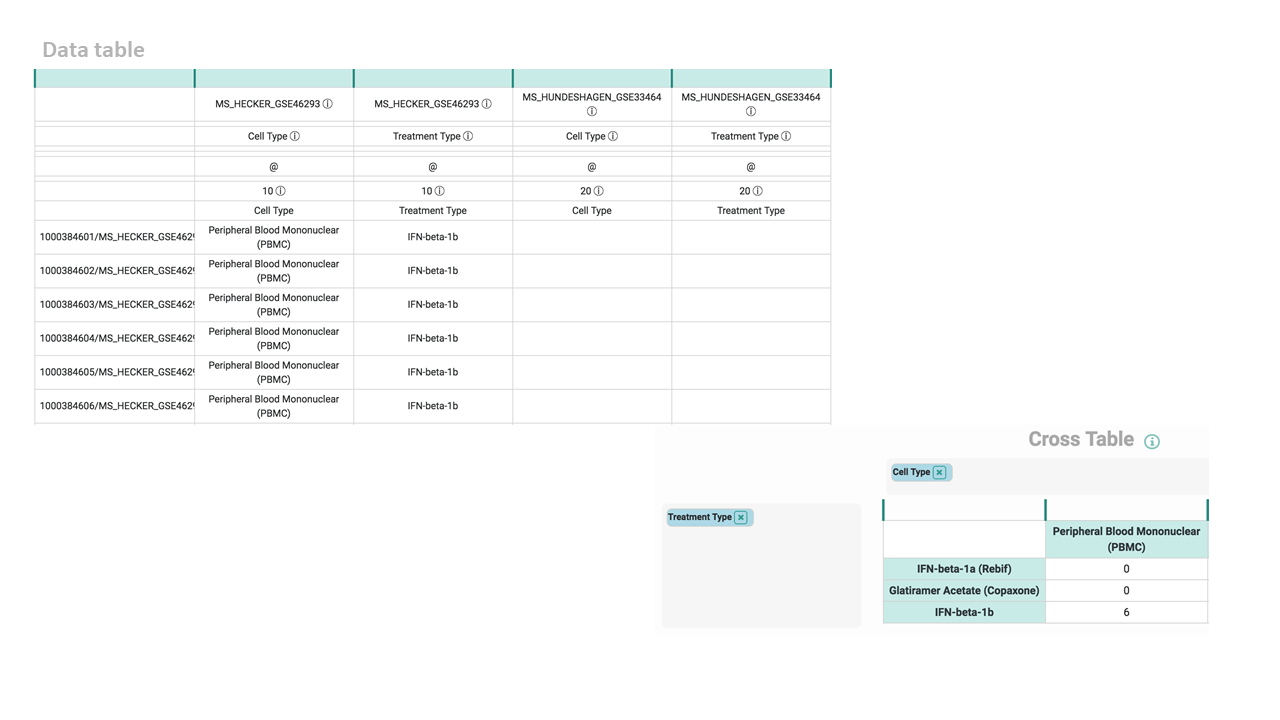
Added features
In the past months, The Hyve’s team worked hard to develop and implement additional Glowing Bear features. For example, we created a cross table for a more comprehensive view based on selection criteria. The existing data table gave an overview of characteristics per patient. Useful, if you want to know which treatments a particular patient gets or got. However, if you want to know how many patients received one particular treatment, you need to count individual patients in the data table. The cross table is more useful in such a case, as it groups patients per treatment. So you can see at a glance how many patients were treated with, for instance, IFN-beta-1b (indeed, 6).
A feature that is currently being developed, is interactive visual analysis via the Fractalis platform. Embedding this platform into Glowing Bear allows users, even those with little or no programming skills, to graphically display results for one or more patient groups. A range of visualisations can be selected, for example scatter plot, box plot and survival plot. Also, subsets can be selected within a graph and analysed separately or compared with other patient selections.
Of course, researchers with more advanced programming skills are still able to export specific data subsets from the tranSMART data warehouse and analyse those with Python or R. As we mentioned before, The Hyve developed both a tranSMART Python and a R client to make data extraction easier.
There are also two tools available that simplify data loading into tranSMART: the Arborist and the tmtk (tranSMART toolkit). The Hyve developed these tools in close collaboration with BMMRI, TraIT and Health RI. This blog post describes how to transform and import data into tranSMART in five simple steps.
Future plans
The official launch does by no means imply that Glowing Bear is now a finished product. While it was built for tranSMART, it has always been our ambition to connect with other data warehouses, thereby further improving the workflow in hospitals, pharmaceutical companies and research institutions. These future connections could link patient data with lab test results, genetic and genomic data, MRI and biopsy images, and biobank databases.
If you have any questions, please don’t hesitate to contact us.


