Almost 400 attendees from all over the world came together during the annual OHDSI symposium to discuss the progress of the OHDSI platform. From The Hyve, Kees and I attended. During the symposium, I gave a talk on the transformation of Swedish EHR data to the OMOP CDM. We also participated in two tutorial days after the symposium.

As always, the symposium gathered a lot of experts in the field of observational data research, and it was great to have an opportunity to hear so many talks from opinion leaders gathered in one place. The talks about the newly developed Patient Level Prediction package were especially inspiring.
The first talk focused on improving palliative care using prediction models. The second was about the prediction of adverse events in patients taking antidepressants. One of the goals is to be able to stratify patients into risk groups for, e.g. getting suicidal thoughts. This brings the work done by OHDSI very close to the clinical practice. With well-designed prediction models, clinicians can use data to answer a question like: “For what outcomes does an individual have a higher (or lower) risk than the population average?”
It was also great to see the progress on extending the OMOP common data model made this year. A lot has changed since version 1, which was released in 2009, to the current version 5.3; for instance, the incorporation of an NLP (natural language processing) results table. Many more suggestions are still being incorporated. This project is an excellent example of how open source collaboration moves the development of OHDSI forward.
Lightning talks
During the lightning talks section, I gave a talk on the transformation of Swedish Electronic Health Data (EHR) to the OMOP common data model, which was developed last year at The Hyve. One of the challenges was to map Swedish source concepts to standard OMOP concepts.
During the talk, we discussed the idea of a vocabulary mapping scoring card to capture the information lost due to this concept mapping. This resulted in new contacts with other groups on improving mapping quality. This gives exciting new opportunities to collaborate and further improve the quality of ETL in the future.
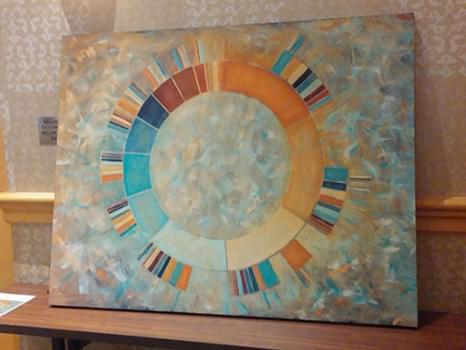
As always, Patrick Ryan gave inspiring opening and closing speeches. As a surprise, he demonstrated five pieces of art based on OHDSI visualizations by Sean Williams. The painting below is the artist's interpretation of the treatment pathways chart from the TxPath tool.
The tutorials
On Thursday and Friday, there were four tutorials in total, covering topics from the design of the OMOP vocabulary to executing specialized statistical analyses with the R packages developed within OHDSI. We were very pleased with the high-quality content of these tutorials.
During the Population Level Effect estimation, we were guided through the design of an observational retrospective study with the focus on how to create and report a study such that it is reproducible by others. Next we created the designed study step by step in Atlas and executed it by using the “CohortMethod” in R. At the end of the tutorial we got a small preview of a ‘JAMA ready’ article that was automatically generated from our study design.
To conclude
It was great to visit the OHDSI symposium again and to have an opportunity to give a talk and share our project with the community. We are looking forward to the OHDSI symposium next year, as well as the OHDSI Europe symposium happening on March 23 2018 in Rotterdam, the Netherlands. We hope to see you there!