The UK Biobank (UKB) is a medical registry containing vast amounts of medical data from 500,000 participants. Last year, The Hyve collaborated with University College London (UCL) to convert the information into the Observational Medical Outcomes Partnership common data model or OMOP CDM (Read more). This article illustrates how we used, adapted, and shared back with the community two of the OHDSI tools leveraged in this project with UCL: Usagi - utilized in the preparation phase, and the Data Quality Dashboard (DQD) - for quality assessment, as part of the conversion of the UKB data mapping project.
Open-source contribution to other OHDSI components
The journey to convert data into the OMOP CDM includes various steps. Within the OHDSI (Observational Health Data Sciences and Informatics) community, several tools have been developed to make the process easier and more standardized. A general workflow using the OHDSI tools includes a thorough preparation phase, the design of the main ETL (Extract, Transform, Load) procedure, a quality assessment process, and finally, making the data available and ready for analysis. The ETL in-depth design is left to the developer, and OHDSI does not maintain a universal tool.
Usagi
The data preparation step before ETL aims to understand the data and produce the syntactic and semantic mappings. The former is done with the White Rabbit tool, which produces a report containing an overview of the source tables with descriptive statistics. The syntactic mapping is simply a detailed document describing how the source tables and fields will be translated into target model ones. This document serves as a reference point for the ETL engineers and is created using the Rabbit in a Hat tool. The second component, the semantic mapping, consists of translating the codes in the source data to an existing “standard,” agreed to be used as a common (within the OHDSI community) vocabulary.
There are different levels of semantic mapping. The source values can either be already coded in the OMOP standard or a “non-standard” vocabulary. When the source values are written in a “non-standard” vocabulary, but a mapping is available, it is simpler to use the existing files. However, suppose the source values are coded in a “non-standard” vocabulary with no existing mapping available or not coded at all (for example, text fields). In that case, the data owner or medical personnel should supervise a conversion effort to the appropriate “standard” vocabularies. Within the OHDSI community, the Usagi tool is used for this effort.
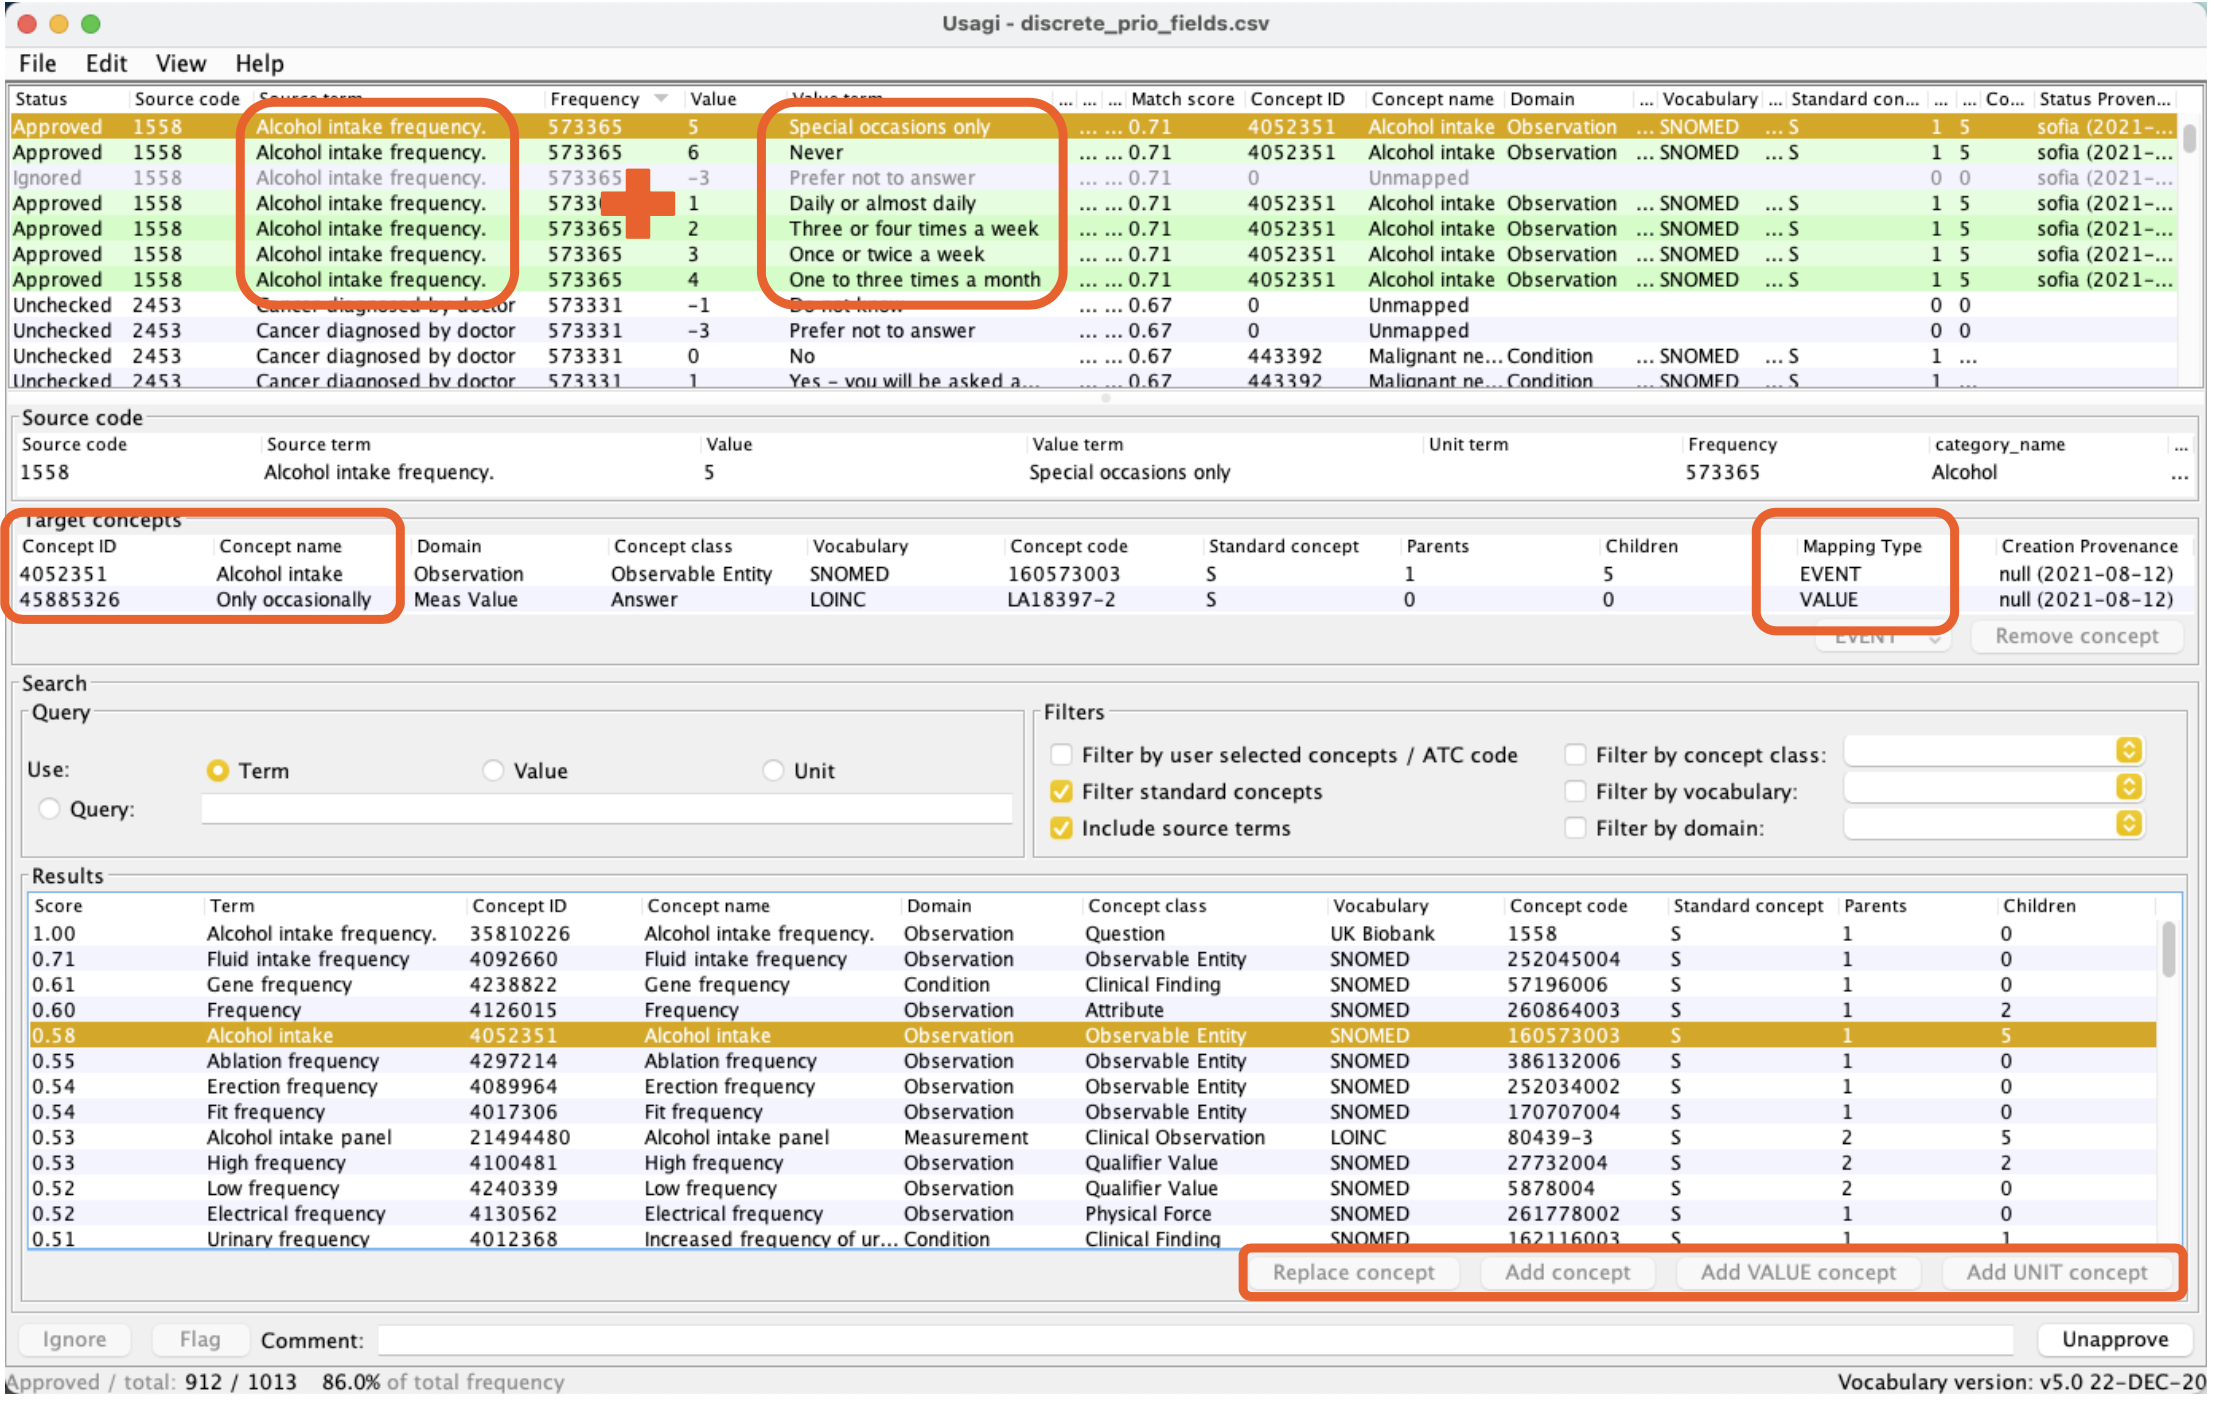
Usagi is a Java application that takes all source concepts and finds suitable equivalent “standard” OMOP concepts. The advantage of Usagi is that it searches for similar terms in common vocabularies and classes and shows a suggested mapping based on a matching score. The Usagi mappings can then be reviewed by multiple people involved in the project. Nevertheless, there might be cases in which the data owner is required to make the final decision based on their expertise.

While performing the preparation steps for the UKB mapping, we found that several concepts required pre-coordination between two or more concepts. For example, the field ‘Alcohol intake frequency’ (1558) can take seven values (1=‘Daily’ to 6=’Never’ and -3=‘Prefer not to answer’), which was different from the typical OMOP perspective and was not supported by the tool. Our proposed solution was to map this field (alcohol intake frequency) into a combination of variables and values from the available standard OMOP concepts. Following the example, the variable concept was ‘Alcohol intake,’ and the value could be ‘Only occasionally.’ We applied these changes - extending the tool Usagi - by allowing the available mappings of a source code to contain multiple standard concepts. You can follow the discussion in more detail in the relevant OHDSI forums post.
Usagi can accelerate the semantic mapping step, but it requires a high level of medical expertise. Thus multiple people often need to work with the same file. The Hyve added metadata fields to Usagi to enhance this collaborative approach. To improve the reviewing process of the semantic mappings, we extended the code to keep track of the authors. The mapping files can now be shared between the collaborators while easily monitoring the participants who produced each mapping.
Similarly, some mappings required special attention. For example, mappings for which there is a higher level of uncertainty (“ill” could refer to many different conditions), or ones that are not worth retaining (“patient wears only pink clothes”). Therefore, this Usagi extension also includes ‘flag’ and ‘ignore’ buttons to highlight those cases, respectively.

Since the user provides the tool with the initial source file, an older version of USAGI can be used if the above cases apply to your data. There is also the option to load older versions of USAGI-export files into the latest version of USAGI; however, not all the fields shown above will be filled, and the user will have to enter them manually.
"A common question is if Usagi can be used as a general vocabulary mapping tool. The application was designed to be used with the OMOP CDM vocabularies, which contains over a hundred source terminologies (Athena Standardised vocabularies) like SNOMED, ICD, LOINC, and RxNORM. However, a user can theoretically index any vocabulary of interest, as long as it is provided in the OMOP format" - Maxim Moinat (Data Engineer, The Hyve).
All additions turned out to be useful, making the concept mapping process more collaborative between The Hyve and UCL, resulting in higher levels of completeness and confidence in the mappings. You can always find the latest version of the tool on its GitHub page!
Data Quality Dashboard (DQD)
Following the general workflow, we can perform the ETL once the preparation step is complete. Once the ETL is achieved, we need to perform a quality assessment to ensure that the data are ready for subsequent analysis, for example, an epidemiological study.
The OHDSI toolset has a tool for this purpose: the Data Quality Dashboard (DQD). It includes a set of distinctive quality checks, organized and harmonized to be comparable between different data sets. It follows the work of M.G. Kahn et al. (2016), where they define three categories of data quality: conformance, completeness, and plausibility. It is important to note that these individual tests are run at the data owners' side, thus maintaining their privacy.
The DQD is an R package that runs more than 3.000 individual quality checks on the OMOPed data. These checks may pass or fail depending on a predefined threshold percentage of the number of rows that satisfy one specific condition for each check. For example, the DQD checks whether a person's year of birth is always after 1850. The DQD runs these tests from the OMOPed database on the data owner's side. Then, it returns a summary of the results in a JSON (JavaScript Object Notation) format file that can be shared among the conversion team members. The DQD summary results can be used to check for major issues in the source data, for example, if compulsory OMOP CDM fields are left empty. It can also check the transformation itself and highlight areas that might need improvement (for example, lack of coverage of certain domains).

In practice, we run the ETL several times to improve the mapping quality. We also run the DQD after each ETL iteration. We can visualize the performance difference between iterations in the - newly added - graph below. In the video below, most of the checks pass (blue dots). Compared to the previous ETL run, most checks remain similar (see dashed line), and a few have improved.


